Project 01 / 04
Qyrus Test Orchestration
Qyrus already had working Web, API, Mobile, and desktop scripts. What teams lacked was a way to connect them, pass data between them, run them as one workflow, and read one result. I designed Test Orchestration: a desktop workspace with projects and workflows, a node canvas built from existing scripts, visible value mapping between steps, and reporting that stays coherent from portfolio totals to the failed step.
Impact
- Workflow canvas
Existing Web, API, Mobile, and desktop scripts run as one journey
- Named hand-offs
Every node publishes outputs the next step can bind to
- Rule builder
Conditions come from variables, operators, and functions instead of script edits
- Shared report
The same run reads from portfolio totals down to the failed step
Capability signals visible in the shipped screens. They describe what the product enables, not adoption, time saved, or business impact.
Problem
The missing product was the journey
A checkout does not care that login is a Web script, payment is an API call, and verification happens on a phone. Testers did, because each surface lived in its own repository, run, and report, and somebody in the middle had to hold the whole flow in their head.
So the product object became the workflow itself: something teams can find, compose, run, and return to. The projects view already shows All Projects (38, as shown), which is why search, sort, owners, counts, and recency stay visible instead of hiding in a second screen.
Decision trailHow the product object was chosen
- Evidence
- Qyrus already shipped Web, API, Mobile, and desktop testing, each with its own script repository and its own report.
- Insight
- The thing teams were missing was not another test. It was the workflow that holds tests together and carries data between them.
- Decision
- Make the workflow the object people create, own, run, and return to.
- Product change
- Projects hold workflows, workflows hold scripts as nodes, a node's outputs feed whatever comes next, and one run produces one report.
- Outcome or limitation
- The model is visible end to end in the shipped screens. Rollout results and post-launch usage are not part of this evidence set.
Find → Compose → Bind → Branch → Run → Read
- 01
Find
- Before
- Work is spread across services and people.
- Design decision
- Open on projects, with owners, counts, and recency.
- Why it helps
- A place to come back to.
- 02
Compose
- Before
- Rebuilding tests that already exist is wasted work.
- Design decision
- Put the script repository beside the canvas.
- Why it helps
- Composing instead of rewriting.
- 03
Bind
- Before
- Values get copied between steps by hand.
- Design decision
- Let every node publish named outputs, and let the next node pick the exact step or field that receives them.
- Why it helps
- Hand-offs you can see.
- 04
Branch
- Before
- Anything conditional means dropping into code.
- Design decision
- Build rules from a picker of the run's own variables, operators, and functions.
- Why it helps
- Logic a tester can write and a reviewer can read.
- 05
Run
- Before
- Each script assumes its own environment, and someone has to be there to press go.
- Design decision
- Set environment and database per script or per workflow, then schedule the run instead of attending it.
- Why it helps
- The same journey runs against staging on Tuesday and production overnight.
- 06
Read
- Before
- A red square told you something broke, not what it broke after.
- Design decision
- One report at four depths: portfolio, run list, the run, and the step that failed.
- Why it helps
- One conversation about quality, with an address for every failure.
- Scripts sat per service, so no one could see a journey end to end.
- Values moved between steps by hand, copied out of one result into the next.
- A red step told you something broke, not what it broke after it.
- Every service reported quality in its own language.
Evidence from the trial
The first model made the flaw visible
The earliest exploration proved the premise and exposed the problem. Nodes sat on one left-to-right band and published their variables as a flat wall of chips grouped by source script. You could connect two nodes, but you could not say which value went where.
The line meant "after", not "carries". The condition icon had the same flaw in miniature: two labelled exits, nowhere to show which value the rule read, and no structure for a third branch. Comparing this trial with the shipped model narrowed the redesign to one job: make data contracts visible, not just sequence.
- The trial connected nodes. The shipped design connects values.
- A flat list of every variable a script owns is a data dump, not a contract.
- One horizontal band reads fine at four nodes and stops being navigable at ten.
- AI belonged beside the library as a way to start, not on every node as a permanent layer.
The hand-drawn note left sitting on that canvas — a numbered list with a plus under it — is the Branch Hub before it had a name.
Design pass
Wireframes carried the branch forward
The wireframe pass took the trial's flat condition icon and gave its exits names — Show superadmin and Show error — so a branch finally read as a rule, not just a fork. A Results tab paired a live workflow diagram with a step-by-step log, and a Results table held every run across every workflow in one list.
It was still one script on one canvas, not yet the multi-script model that shipped — but the branch, the live run view, and the results table all carried forward into the final design.
- Named exits on the condition node, not just an icon with two lines.
- A live workflow diagram paired with the run log, not a log alone.
- One results table across every workflow — the shape the shipped Reports dashboard grew from.
First-time state
Start with real work, even when the workspace is empty
The canvas opens beside the script library, not a blank palette. Pick a service, walk the same repository your team already uses, and drag a script into the flow. Nothing gets rewritten to become part of a journey.
Because most enterprise tools are empty on day one, the empty states do instructional work. Projects tells you how to begin, Workflows routes you back to where creation actually happens, and Reports admits that evidence does not exist until a run does.
- Every empty state names its own object, so you always know which shelf is bare.
- The action lives on the screen, either as the highlighted button or a route to where that action exists.
- The nav stays intact, so an empty screen never feels like a broken one.
- The primary authoring move is reuse: bring existing scripts onto the canvas.
Data model
Make every node carry a usable contract
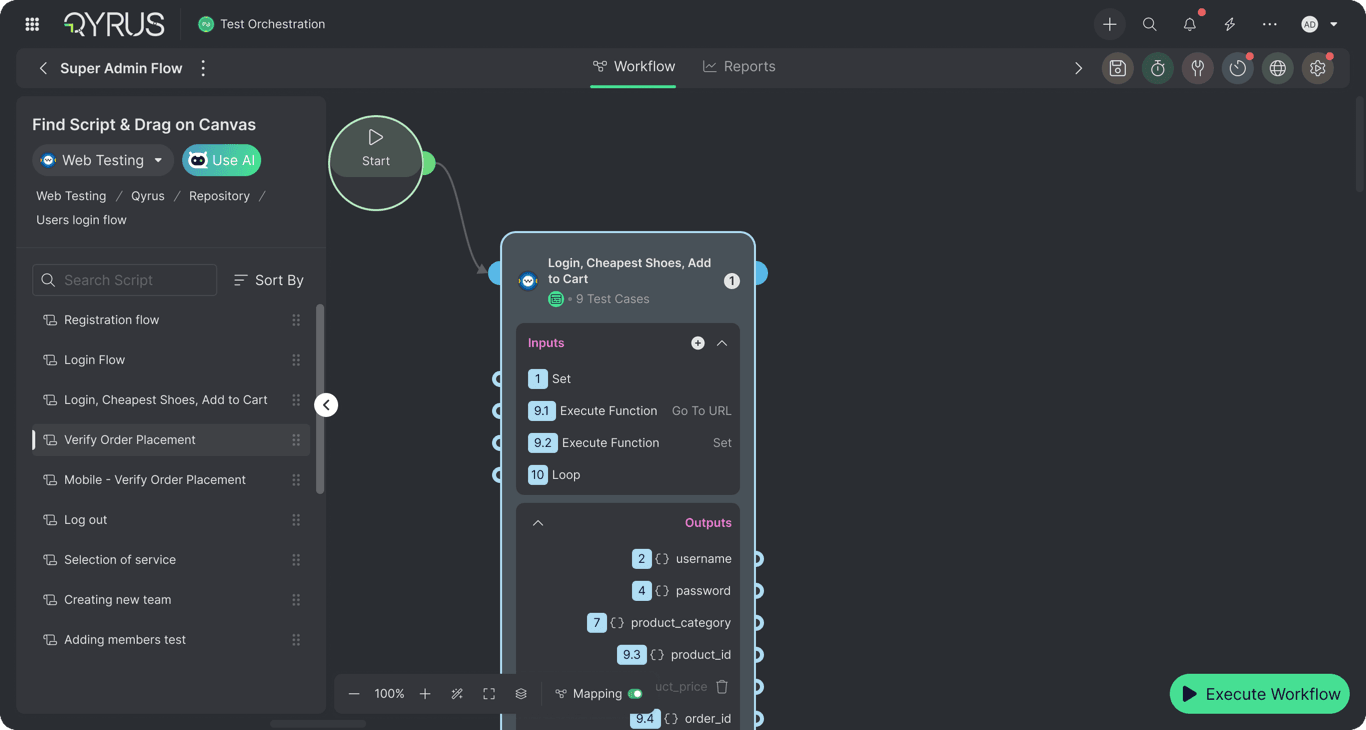
Redrawn, a node stops being a black box without becoming a data dump. It shows the steps it will run in script order and the outputs it produces, each on its own port, so a connection can mean one specific hand-off instead of a vague dependency.
That only works if incoming data can land precisely. Web actions, API requests, and mobile loops all use the same input-dialog structure — search, filters, mapped-only toggle, warning, and Save — while each service keeps the vocabulary of its own data model.
- Outputs are named variables with ports, so a line says exactly what it carries.
- Turning Mapping on makes those hand-offs visible on the canvas instead of hiding them in a settings drawer.
- Each row shows what the step actually does, so you map by meaning rather than by index.
- One dialog, three data models. Learn it once on Web and you can use it on API or Mobile.
The trial connected nodes. The shipped design connects values.
Control flow
Branching and operational steps stay readable on the same canvas
Real journeys fork, wait, retry, stop, and notify. The moment those actions require code, the person who owns the workflow stops being the person who can change it.
The expression builder opens on values the run already knows — upstream node outputs and Data Hub columns — then adds operators, functions, and keywords from adjacent tabs. Utilities stay visually distinct as circles with stable colours, while Alert separates composing the message from deciding whether Slack or Teams should fire.
- Variables are grouped by source node, so a name is never detached from where it came from.
- Only real values are offered — the picker is the run's actual scope, not a language reference.
- Wait, Retry, Stop, Alert, Send Mail, Start, Transform, and Create JIRA Issue share one shape and one footer.
- Notification targets stay optional and named, so an alert never silently posts to the wrong place.
Runtime
One workflow can run across environments and time
Enterprise orchestration fails if the canvas and runtime disagree. Environment settings therefore work at two altitudes: one workflow context for everything, or per-script environment and database settings listed in execution order, with the same node numbers the canvas uses.
That structure holds when the flow spans services: a Web script publishes product_price, a Branch Hub decides what happens next, an API verifies the order, mobile checks the result, and the same flow can then be scheduled to run unattended. A recurring run is an auditable commitment, so cadence, next run, progress, and owner stay on the row.
- Scripts are listed in run order, so the dialog and the canvas agree on sequence.
- Environment and database stay separate because teams routinely swap one without the other.
- Ports are per value, not per node, so cross-service hand-offs stay specific.
- Pause is reversible on the schedule row, because stopping a run and deleting one are different intentions.
The thing a person used to hold in their head is now drawn, configured, and scheduled in one place.
Execution evidence
One report answers where, then why
Reporting is one system at four depths: portfolio, run list, the run, and the failing step. The dashboard shows pass and fail, service usage, and where execution time goes; the list keeps five real statuses distinct instead of flattening everything into green or red.
The reports views show 2,952 executions (as shown), so search and filters are structural, not decorative. Open a failure and the report answers where before why: first the step that failed in sequence, then expected versus actual values, loop index, printed branch rule, API assertions, headers, and response.
- Summary answers where, Detail answers why. One report at two depths, not two reports.
- Run configuration stays on screen, so nobody debugs the wrong browser, device, or environment.
- Skipped assertions stay visible and labelled optional rather than disappearing from the story.
- A failure stops being a colour and becomes a sentence you can act on.
The same execution-order number follows a step from the canvas, through setup, and out the other side into the report. That thread is the design.
Outcome and limits
What the screens prove, and what they don't
What this evidence set covers is the complete loop, and it closes where it opened. The problem was that a red step told you something broke but not what it broke after. By the end of this set, a failed run names the step, the rule it evaluated, the value it expected, and the value it got — each traceable back to a node on the canvas.
What it does not cover is what happened next. These are shipped screens, not a release record. I can show that the model is coherent and that a tester can follow it end to end; I cannot yet show that it saved anyone time, and I would rather say that than decorate the work with numbers I did not measure.
What I would measure next
- Time to first workflow
- Tests whether a new team gets from an empty workspace to a running journey without help.Product events, or a timed first-use study.
- Scripts reused per workflow
- Shows whether people compose from the library or quietly rebuild tests inside orchestration.Workflow composition data over a defined period.
- Mapping errors before a successful run
- Tells us whether visible inputs and outputs actually prevent broken hand-offs.Run history paired with validation failures.
- Cross-service workflows as a share of all workflows
- Reveals whether orchestration connects the portfolio or just adds a canvas to one service.Production workflow telemetry by service type.
- Report depth reached after a failure
- Checks whether people stop at the red status or actually get to the step, the assertion, and the fix.Report navigation events, paired with edit-and-rerun history.